[Home](https://bestuxportfolios.com/)/[Case studies](https://bestuxportfolios.com/case-studies/)/California DHCS
UX CASE STUDY
# California DHCS.
Public-sector healthcare reporting, data visualization, and dashboard organization.
[Work by Fuselab Creative](https://bestuxportfolios.com/portfolios/fuselab-creative/)·[By Best UX Portfolios](https://bestuxportfolios.com/authors/best-ux-portfolios/)·Published Nov 17, 2026·Reviewed Nov 17, 2026
**INTERFACE TYPE:** Dashboard
**INDUSTRY:** Healthcare
**AGENCY:** [Fuselab Creative](https://bestuxportfolios.com/portfolios/fuselab-creative/)
**PROJECT STAGE:** Not independently confirmed
[](https://bestuxportfolios.com/images/projects/fuselab-dhcs-interface-1200.webp)
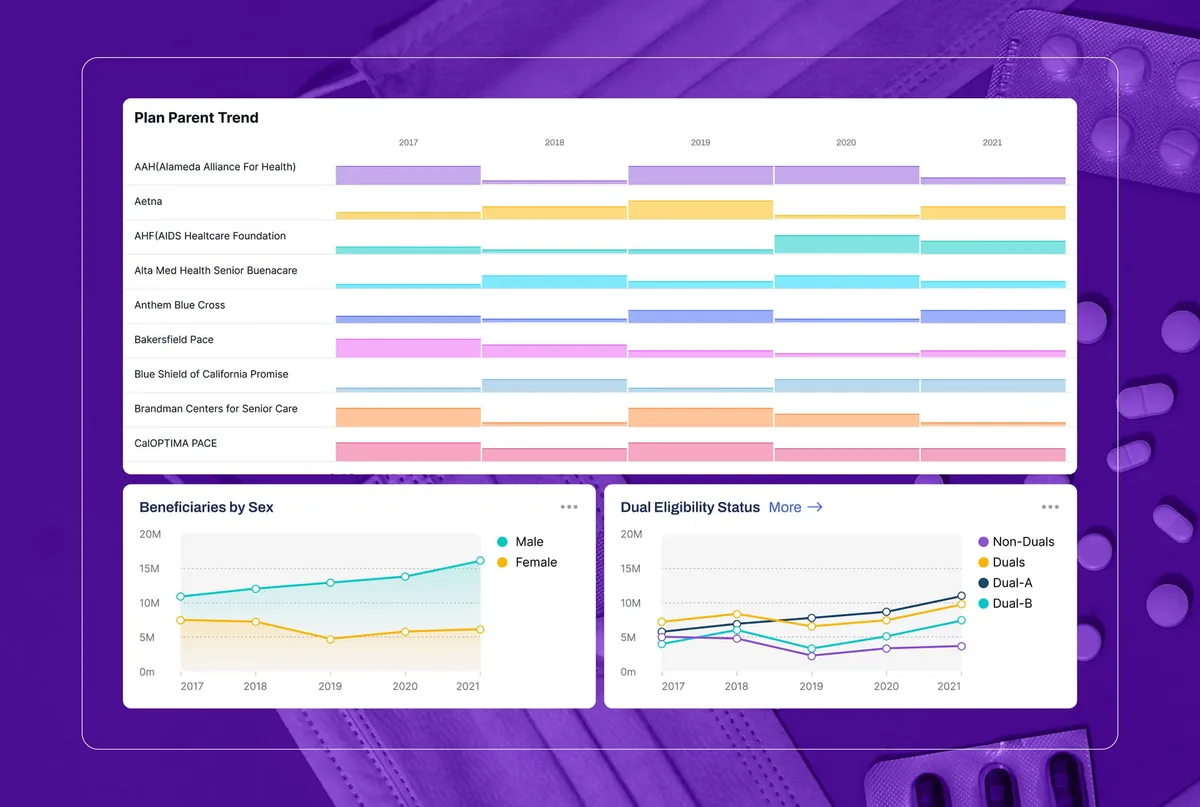
California DHCS: interface example from the official agency account. Credit: Fuselab Creative. [Official source ↗](https://fuselabcreative.com/our-projects/dhcs/). [Open full image](https://bestuxportfolios.com/images/projects/fuselab-dhcs-interface-1200.webp)
## The problem and context
The Business Intelligence Division of California’s Department of Health Care Services (DHCS) tracks data on residents who receive long-term services and supports (LTSS). Fuselab Creative reports an ongoing engagement, now in its second two-year contract, covering research, design, and development of public-program dashboards. [Fuselab Creative’s original account](https://fuselabcreative.com/our-projects/dhcs/).
According to the agency, DHCS asked for visualizations that would make disparity data readable for **non-technical government stakeholders**. The data had to be filterable by county, ethnicity, language, age group, and delivery system, and usable on desktop and mobile without training.
This is public-health program reporting, not bedside clinical software. The users are policy staff, program managers, and administrators who arrive with a question rather than a query.
### The constraints
- **Several data dimensions, each with a different shape.** Geography, demographic change over time, and proportional flows between age groups do not suit one chart type.
- **No training budget for users.** Every dashboard has to be understood on first visit.
- **A platform that keeps growing.** New dashboards are added over the life of the contract, so each one has to fit a shared visual language.
## Design decisions worth examining
### 1. Choose the chart from the shape of the data
Fuselab describes matching each dimension to a chart type: a bubble plot for ethnicity and language (size and change over time together), a choropleth map for county-level distribution, and a Sankey diagram for age groups (proportional flow across years). The dataset covers 2017 to 2021. [Fuselab Creative’s original account](https://fuselabcreative.com/our-projects/dhcs/).
**Our reading:** this is the central lesson of the project. A dashboard built from one favourite chart type forces some questions into awkward forms. Here each view answers a specific question: *where*, *who and how is it changing*, *how do groups move between categories*.
**What to watch for:** choropleth maps exaggerate large, sparsely populated counties, and Sankey diagrams get hard to read as categories multiply. The published images do not show how small counts or many categories are handled.
### 2. Put the most important figure on screen before any interaction
The agency reports that each dashboard surfaces its most critical metrics on load and lets users drill into county or demographic detail with a single filter action. Hover tooltips add explanation without crowding the main view. [Fuselab Creative’s original account](https://fuselabcreative.com/our-projects/dhcs/).
**Our reading:** for occasional users, the default view *is* the product. Many will never touch a filter. Leading with the key figure, and keeping explanations in tooltips, respects people who need one answer quickly.
**What to watch for:** information that lives only in hover tooltips is hard to reach on touch screens and for keyboard users. The account says the dashboards work on mobile but does not show how tooltip content is exposed there.
### 3. Design search around questions, not data structure
Fuselab describes a search layer with autofill suggestions, simple date pickers, and pre-selected dropdowns, so users can start without knowing the underlying data architecture. [Fuselab Creative’s original account](https://fuselabcreative.com/our-projects/dhcs/).
**Our reading:** pre-selected defaults do quiet but important work. They show a stakeholder what a sensible starting question looks like and make an empty result less likely.
## Contribution, outcomes, and evidence
**Documented contribution:** user research (persona and goal definition), requirements, interviews and surveys, visualization experiments with clickable prototypes, test-and-refine cycles, and design and development of the dashboards, per Fuselab. The agency reports that several dashboards have been deployed and more are in production under the ongoing contract.
**Outcomes:** the page includes a client testimonial praising the collaboration and an aggregate review rating from a third-party directory. These describe client satisfaction with the working relationship. They are not usage data or evidence that stakeholders reached better decisions, and the page does not publish such measures.
**What we did not verify:** we have not used the live dashboards or checked their accessibility. The design reasoning above is from the agency’s account; the “Our reading” passages are our interpretation.
## A practical lens
- **List the questions before choosing charts.** Write down each question the audience asks, then pick the chart that answers it. It will rarely be the same chart twice.
- **Make the default view sufficient.** Assume many visitors will not interact. What must they see without clicking?
- **Keep a shared visual language for a growing set of dashboards.** Consistent patterns mean each new dashboard costs users nothing to learn.
**Where this may not transfer:** this audience needs *orientation*. Analysts who explore data daily need dense, configurable views and exportable tables. Simplicity that helps a policy reader can frustrate an expert.
## Original source and editorial responsibility
Source: [Fuselab Creative’s original account](https://fuselabcreative.com/our-projects/dhcs/), checked 16 November 2026. Written by Best UX Portfolios from the agency’s published case study and images. We have not tested the live dashboards or interviewed DHCS. Spotted an error? [Request a correction](https://bestuxportfolios.com/contact/#corrections).
## Keep exploring
[Fuselab Creative portfolio](https://bestuxportfolios.com/portfolios/fuselab-creative/)[Dashboard UX](https://bestuxportfolios.com/collections/dashboard-ux/)[Request a correction](https://bestuxportfolios.com/contact/#corrections)
## Another perspective on the work.
[All case studies](https://bestuxportfolios.com/case-studies/)
Conversational AI·Enterprise
### [Stardog Voicebox](https://bestuxportfolios.com/case-studies/fuselab-stardog/)
[By Fuselab Creative](https://bestuxportfolios.com/portfolios/fuselab-creative/)
Conversational data workspace, visible source data, and interface/design-system choices.
AI workspace·Research
### [Ipsos Facto](https://bestuxportfolios.com/case-studies/goinvo-facto/)
[By GoInvo](https://bestuxportfolios.com/portfolios/goinvo/)
Research workflows, prompts, citations, and AI transparency.
Workflow·Healthcare
### [Maya Healthcare EHR](https://bestuxportfolios.com/case-studies/goinvo-maya/)
[By GoInvo](https://bestuxportfolios.com/portfolios/goinvo/)
Nursing/home-health workflows, scheduling, intake, and administration.